Today’s Real Estate Market: The ‘Unicorns’ Have Galloped Off
Keeping Current Matters June 6, 2023
Buyer

Keeping Current Matters June 6, 2023
Buyer
Comparing real estate metrics from one year to another can be challenging in a normal housing market. That’s due to possible variability in the market making the comparison less meaningful or accurate. Unpredictable events can have a significant impact on the circumstances and outcomes being compared.
Comparing this year’s numbers to the two ‘unicorn’ years we just experienced is almost worthless. By ‘unicorn,’ this is the less common definition of the word:
“Something that is greatly desired but difficult or impossible to find.”
The pandemic profoundly changed real estate over the last few years. The demand for a home of our own skyrocketed, and people needed a home office and big backyard.
It was a market that forever had been “greatly desired but difficult or impossible to find.” A ‘unicorn’ year.
Now, things are getting back to normal. The ‘unicorns’ have galloped off.
Comparing today’s market to those years makes no sense. Here are three examples:
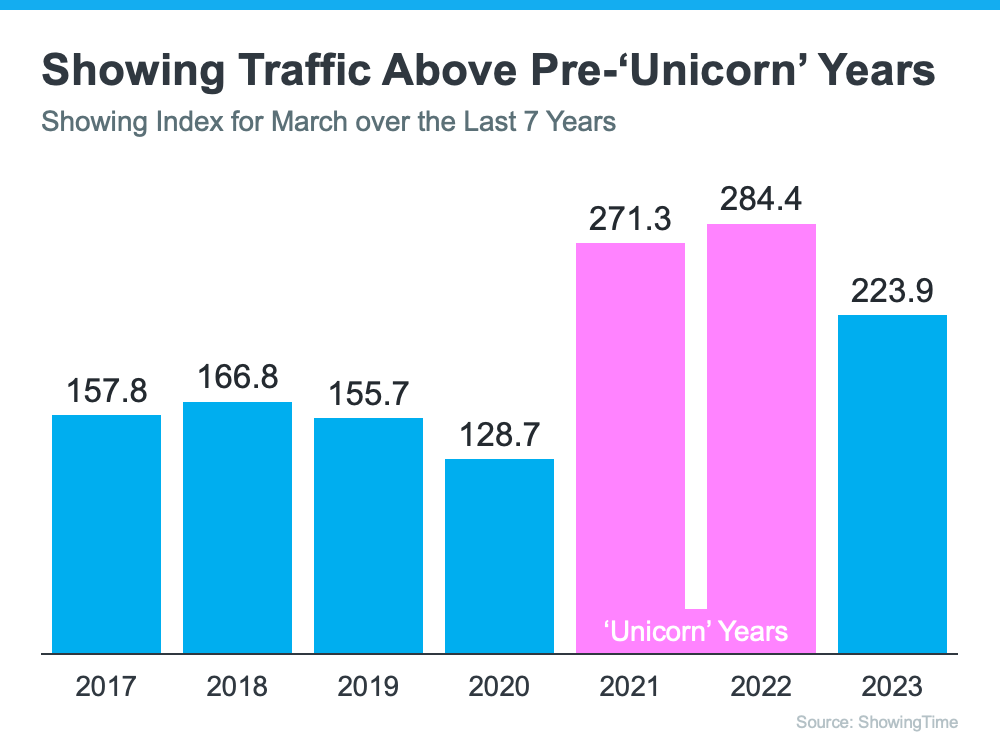
If you look at the headlines, you’d think there aren’t any buyers out there. We still sell over 10,000 houses a day in the United States. Of course, buyer demand is down from the two ‘unicorn’ years. But, according to Showing Time, if we compare it to normal years (2017-2019), we can see that buyer activity is still strong (see graph below):
We can’t compare today’s home price increases to the last couple of years. According to Freddie Mac, 2020 and 2021 each had historic appreciation numbers. Here’s a graph also showing the more normal years (2017-2019):
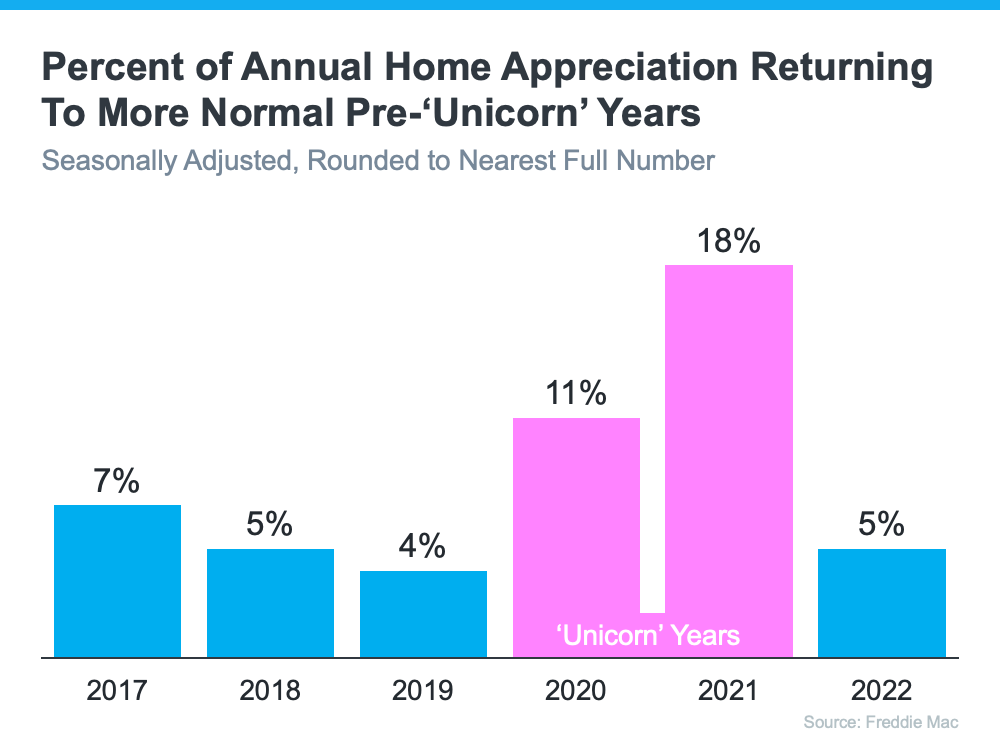
We can see that we’re returning to more normal home value increases. There were several months of minimal depreciation in the second half of 2022. However, according to Fannie Mae, the market has returned to more normal appreciation in the first quarter of this year.
There have already been some startling headlines about the percentage increases in foreclosure filings. Of course, the percentages will be up. They are increases over historically low foreclosure rates. Here’s a graph with information from ATTOM, a property data provider:
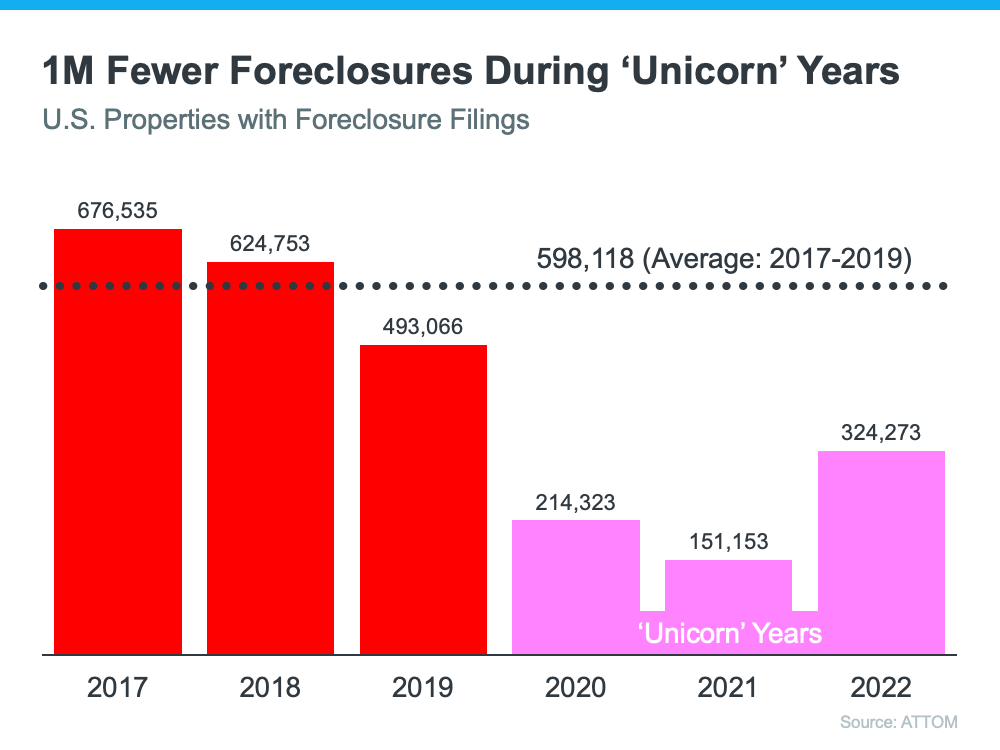
There will be an increase over the numbers of the last three years now that the moratorium on foreclosures has ended. There are homeowners who lose their home to foreclosure every year, and it’s heartbreaking for those families. But, if we put the current numbers into perspective, we’ll realize that we’re actually going back to the normal filings from 2017-2019.
There will be very unsettling headlines around the housing market this year. Most will come from inappropriate comparisons to the ‘unicorn’ years. Let’s connect so you have an expert on your side to help you keep everything in proper perspective.
Stay up to date on the latest real estate trends.

Buyer
June 23, 2026

Buyer
June 23, 2026

Buyer
June 23, 2026

Buyer, Seller< Main
June 18, 2026

June 18, 2026

Buyer
June 17, 2026
We Guide Homeowners through the complicated process of selling their home using our 4 Phase Selling Process and 3 Prong Marketing Strategy that alleviates their stress and moves them effortlessly to their next destination. Schedule a 15 Minute Complimentary Strategy Session Today